Imported vehicles made up nearly 60% of total light new-vehicle sales in South Africa in 2023. So, which countries ship over the majority of Mzansi’s imported cars? We have the numbers.
In 2023, imported cars represented 59.3% of South Africa’s total light new-vehicle sales, with 295,817 units (out of 498,880 units) shipped into Mzansi from 24 countries, according to Naamsa. Though that’s down on the 64.8% share achieved in 2022, it’s nevertheless a significant number.
Drilling down into the data, we see that passenger-vehicle imports accounted for 76.9% of total passenger-car sales in South Africa last year, while light-commercial vehicle (LCV) imports represented 18.8% of that segment’s sales total in 2023. So, which countries sent over the majority of SA’s imported vehicles in 2023?

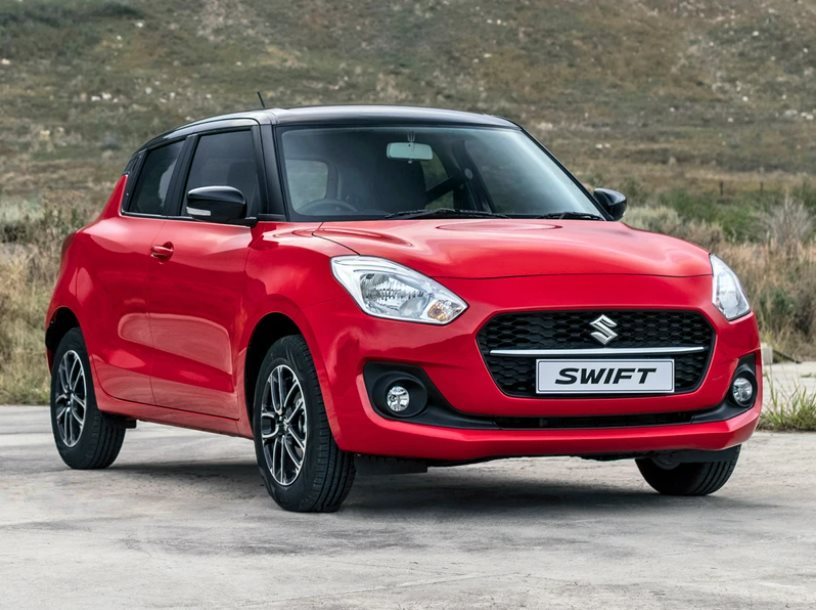
The Indian-built Suzuki Swift was SA’s best-selling imported car in 2023.
Well, according to new information released by Naamsa, the top country of origin in pure volume terms was again India, which shipped over 157,326 units – or a whopping 53.2% of the total light vehicles imported – in 2023. For the record, that percentage is up slightly on 2022’s effort of 51.2%.
Of course, several global brands have established large-scale production facilities in India over the past few years, focusing primarily on budget vehicles. Many of these are relevant to South Africa, with four of SA’s 10 best-selling passenger vehicles last year produced in India (the Suzuki Swift, Toyota Starlet, Hyundai Grand i10 and Nissan Magnite).
Meanwhile, China consolidated its second position, accounting for 39, 308 units or 13.3% of all light-vehicle imports in 2023 (up from 10.79% in 2022). The Chery Tiggo Pro and Haval Jolion were the biggest passenger-vehicle drivers of volume here, while the GWM P-Series played that role in the LCV space. Next came Japan, which retained third position with 21, 507 units, closely followed by Germany (21, 017 units) in fourth.
South Korea (13,771 units) held steady in fifth place, though Spain (13,650 units) was right on its tail in sixth spot. Interestingly, the United Kingdom climbed three rankings to seventh, having supplied 4,506 units to South Africa in 2023, while the United States (3, 908 units) and Thailand (3, 784 units) remained in eighth and ninth, respectively.

Premium cars like the Dingolfing-built BMW 5 Series helped Germany to 2nd place in Rand value terms.
Finally, France closed out the table with 2,228 units, pushing Indonesia out of the top 10. The remaining 14 countries of origin collectively accounted for a further 14,812 units last year. Interestingly, in Rand value terms (as opposed to pure volume), India was again the main country of origin, though Germany took second place, with Japan completing the podium.
Top 10 countries of origin for SA’s imported light vehicles in 2023
1. India – 157, 326 units
2. China – 39, 308 units
3. Japan – 21, 507 units
4. Germany – 21, 017 units
5. South Korea – 13, 771 units
6. Spain – 13, 650 units
7. United Kingdom – 4, 506 units
8. United States – 3, 908 units
9. Thailand – 3, 784 units
10. France – 2, 228 units
This article was originally published on Cars.co.za...


